Do you do things by the book, or do you like to improvise? Both have their benefits in various situations. However, in project management, going by the book might be a smarter choice.
According to a PMI report, two key culprits cause project and program failure. The first is a lack of clearly defined or achievable milestones and objectives to measure progress. The second is poor communication.
Both of these can be avoided if you follow the project life cycle and do your best to apply all the best practices in each phase. So, if you’ve struggled with either of these on recent projects, it might be worth scanning this blog to see where you may have gone wrong. We explain the logic behind the project life cycle and share the core activities a project lead should take at each stage.
What is the project life cycle?
The project life cycle is the five-phase process every project normally follows to go from an initial idea to the final launch. While some project teams have their own versions with more or fewer steps, most project teams follow the standard five-phase sequence, which includes:
- Project Initiation
- Project Planning
- Project Execution
- Project Monitoring & Control
- Project Closure
In most cases, the project life cycle is owned and led by a project manager. However, in larger organizations, it can also be managed by the Project Management Office (PMO).
What is the purpose of the project life cycle
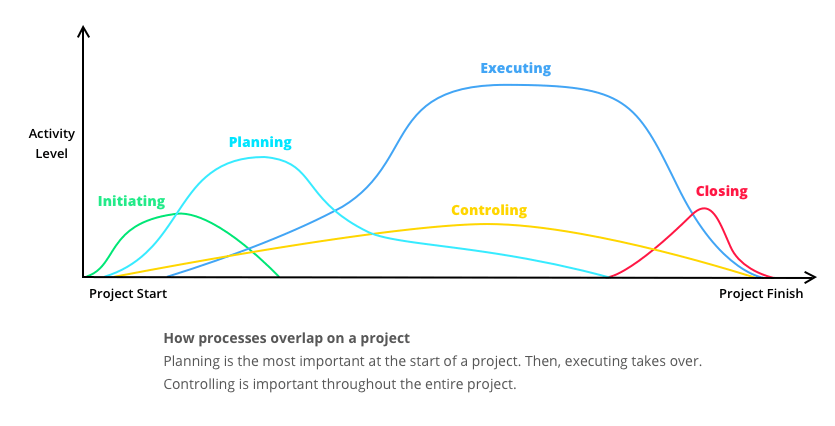
The purpose of following a project life cycle is to create a logical order system that will help project teams develop, plan, monitor, and control the project throughout its entire journey in an effective manner.
Following the five steps helps:
- Project managers, their teams, and stakeholders stay on the same page as they work to achieve a common goal in an ordered manner
- Everyone on the project stays within the project scope and budget that has already been predetermined
- Identify potential risks in the early stages of a project, which can be actioned and managed early, preventing some of the most common project delays later down the line.
5 project life cycle phases
Now that you know what a project life cycle is and why it’s used in successful project management, let’s take a look at what each phase involves in detail.

Project initiation
Project initiation is the first phase of a project lifecycle, where the project manager, or PMO, researches and evaluates the feasibility of the project idea. It involves developing a persuasive project pitch and supporting documents to argue the project’s case.
The project initiation phase serves two purposes:
- Project rationale & approval – To clearly define and present the benefits the project will produce to get support, approval, and funding from stakeholders, sponsors, and key decision makers.
- Sets project foundations – When done properly, it also sets the groundwork for the next project phase, which is planning.
No, there are six parts to the project initiation phase:
- Establish your stakeholders – Identify your primary and secondary stakeholders and create a stakeholder register.
- Build your business case – This is a document that outlines in detail the purpose of the project and establishes the value it presents to the business’s overall strategy and stakeholders.
- Run a feasibility study – For smaller projects, this step might be skipped, however, there is a huge benefit in having a feasibility study because it evaluates if your project is an achievable and worthy feat based on the resources you have to work within the given business environment.
- Develop a Project Initiation Document (PID) or project charter – The PID or project charter is the final document you need to develop before you pitch your idea for approval. In most cases, a PID will be made up of several documents that cover things like the business case, scope, budget breakdown, resources, risk plans, roles and responsibilities, project controls, communication plans, and a project schedule.
- Project pitch – Once all the paperwork is complete, it’s time to pitch your project proposal like a true storyteller. Here, you need to make compelling claims that have purpose and demonstrate they will deliver a much-desired impact for the business.
- Assemble your project team – If you get the green light from your decision makers, the final step in this phase is to gather up your project team.
This first stage is vital in any project because it determines and demonstrates whether your idea moves on to become a live project. There’s a lot of work involved, but the more comprehensive you are, the greater your chances of success!
If you want to know more about this first step, check out our full guide on the project initiation phase.
Project planning
Project planning is the second phase in a project life cycle, and it’s where you take a structured approach to set up a clear, almost step-by-step strategy for your project execution. It involves defining goals, scope, timelines, resources, and supporting project documentation.
The purpose of the project planning phase is to help you:
- Establish a plan of attack – Where you clearly define all project goals, tasks, deadlines, and milestones that will be assigned to the project team.
- Visualize and monitor progress – Once you have your project plan, it’s much easier to understand, manage, and monitor each of the tasks that will drive progress.
Nine things need to be addressed in this phase to create a project plan:
- Define goals & objectives – Make sure you clearly define what will be achieved with this project. This keeps everyone focused on the same goals, and it also gives them a better understanding of why they are doing the tasks that have been assigned to them.
- Identify key stakeholders – From the previous step, you’ll already have the stakeholder register. It’s vital you know who you’ll need to interact with and get feedback from while developing your project plan.
- Set project success metrics – You must include key metrics that are measurable. So avoid vague metrics and go for specific goals (in numbers) that are time-bound.
- Create a Work Breakdown Structure – Before you can assign tasks, you need to create a WBS where you identify the main project deliverables and then divide those into all their smaller sub-parts.
- Agree on key milestones & deliverables – To motivate your project team and give everyone a sense of achievement throughout the entire project, you should agree on several milestones that will represent small wins before everyone gets to the final deliverable.
- Create a timeline & schedule – Having the milestones we just mentioned above will help make the timeline and schedule creation less challenging. Start with the first milestone and refine and build it out using the project schedule you created in the initiation phase.
- Create a project documentation hub – Your project documentation hub will include things like a project charter, budget plan, risk management plan, change management plan, and communication plan.
- Align on communication – Together with the documentation hub, you also need to agree on the communication channels and types that will be used for updates to the project team and stakeholders. You also need to determine the regularity of communication.
- Share, gather feedback, and refine – Once you’ve completed all these steps, you’ll need to share your project plan and accompanying documents with relevant stakeholders, sponsors, and leaders to get their feedback. If needed, make changes and save the final copy, which everyone can view for reference.
The first two phases of a project's life cycle are complex. They take time to develop, and because you’ll need to collaborate and create various documents and share them, the most efficient way to get through these processes is to use appropriate software.
A project management or work management tool like ActiveCollab can be invaluable because it serves as a centralized platform and repository for all your project documents and collaboration.
On top of that, it also lets you run and manage all the workflows of a project from start to delivery.

If you want to know more about how to create a rewarding project plan, check out our project planning guide.
Project execution
Project execution, or project implementation, is the third phase of the project lifecycle. This is the longest phase because it’s where all the work you’ve just planned gets done. It’s where tasks are allocated, monitored, and delivered.
In the project execution phase, the project manager has three key responsibilities:
- Assign, monitor & manage teams & tasks – From the work breakdown structure and project schedule that was developed earlier, the project manager takes and assigns all tasks for actioning.
- Track and report progress – As the project work progresses, they keep a close eye on the assigned tasks so they can provide updates to stakeholders and the leadership team.
- Identify risks & manage changes – Overseeing and managing the entire project, they also keep an even closer eye on any unforeseen delays or blockers that prevent the team from moving forward.
In total, there are six core elements to successful project execution:
- Project organization – This involves creating an organizational structure for your project team that outlines who does what and who they need to turn to for support or approvals.
- Project schedule – This is the document you will keep coming back to constantly because it’s your guiding light in terms of start and finish dates for individual tasks and larger milestones. It’s your key progress tracker.
- Resource plan – This is a list of resources you have at your disposal and the breakdown of those resources across all tasks. It helps you plan and make changes in case team members leave.
- Project budget – Through the execution phase, you’ll need to monitor your resource allocation to make sure it aligns with the budget.
- Risk management plan – In case things don’t go according to your project plan and delays or blockers pop up, the risk management plan should list possible mitigation strategies that will get everyone back on track quickly.
- Communication plan – Finally, one of the most important parts of the execution phase is making sure your team and stakeholders are updated regularly and that they know where to go for all the documents and information they may need on the project. Most project managers also develop project roadmaps, which stakeholders can access to view how the project is tracking.
Now, keep in mind that if you’ve been comprehensive with the previous steps, you will probably have good base documents already created that will help you manage and drive the project. In the execution phase, you will simply supervise, refine, add, and edit as you monitor each core element.
Project monitoring & control
Project monitoring and control is the fourth phase of the project life cycle. However, unlike all the other phases, this is the only one that’s done simultaneously while the project is in the project execution phase. It’s where project managers monitor the project’s overall performance and take corrective action to fix impending issues.
The project monitoring and control phase has one primary purpose: to make sure the project is delivered on time and within budget.
There are five steps a project manager can take to successfully manage the project monitoring and control phase:
- Create project baseline documents – Many project managers use a project baseline as a reference document to drive and track actual progress against their initial project plan. The most common ones include project scope baselines and project schedule baselines.
- Estimated & actual project costs – Few projects are completed within budget. To minimize this unwelcome situation, in this phase, project managers aim to land on and strictly follow their budget breakdowns. However, they also try to keep costs and expenses to a minimum.
- Create a risk log – As the project kicks off, it’s important to start logging any risks that pop up. That way, you can refer to the risk plan you put together in the previous phases and identify the right fixes.
- Create a change log – Similar to the previous one, a change log where you list all changes that occur on the project so you can stay on top of all the things that didn’t go to plan.
- Set up quality control procedures – This one often gets overlooked, but it’s super important that the end result is not just delivered on time and within budget, but also that it's of the quality stakeholders and customers expect.
Project closure
Project closure is the last phase of the project life cycle. It’s where you finalize the administrative tasks, evaluate the journey, debrief stakeholders, and disband the project team. Most project managers develop an official project closure report that summarizes the outcome of the project.
Project closures are important because they deliver two invaluable things:
- Finality – They mark the official end of a project for the project team, as well as a transition point that marks the handover of projects to clients or new team owners.
- Insights – They also capture valuable insights and lessons learned from the journey, which can be used to make better decisions on future projects.
There are seven steps in the project closure phase:
- Finalize administrative tasks – This includes closing contracts, paying invoices, and getting final signatures and approvals from stakeholders.
- Conduct a project post-mortem – Gather all your project team members to evaluate the entire project journey and get feedback.
- Write a project closure report – Have an official document with a clear summary of what was achieved with the provided funds and what was learned from this project.
- Hold a client or stakeholder debrief – This step lets you provide a final report to the people who have trusted you with the project and explain why the initiative was or wasn’t a success.
- Create a future improvement roadmap – This is not compulsory, but if you like, you can develop a plan of actions you would suggest for future upgrades.
- Handover – Before the project manager says goodbye to the project, they must hand it over to the team who will become its new owner.
- Thank, celebrate & farewell – The final step is to gather up the project team, thank them, celebrate the success, and say farewell to everyone so they can go and work on new projects!
If you want to know more about what a proper project wrap-up looks like, check out our detailed guide on project closure.
Types of project life cycles
Now, we did say the project life cycle helps create a sense of order and sequence, and that’s true, however, projects come in different types, sizes, and forms.
Some follow a linear process, which lets them shadow the project life cycle stages in a linear way. Others, not so much. They prefer a more flexible approach where they can turn back, fix things, and then move forward again., Others still like to divide their project into smaller chunks, where they work on one deliverable at a time.
To explain what we mean by this, we’ll define three of the most common types of project life cycles and share an example of how each one might customize the flow and order of the five-phase project life cycle to their preferred way of working.
Waterfall (linear) life cycle
The waterfall life cycle, also known as the predictive or linear lifecycle, is the simplest type and follows the five phases in a sequenced and structured manner.
With this type of cycle, there is no back and forth. The project starts with the initiation phase and goes through each next phase until it reaches a close. So for a new phase to start, all the previous ones must have been completed in the exact order displayed below (except for the execution and control and monitor phase, which happen in tandem).

The waterfall life cycle is applied to simple projects, usually when there is no need for excessive feedback, testing, and trials.
Agile (iterative) life cycle
The agile life cycle, which is also sometimes called the iterative life cycle, is a much more flexible type because it promotes and allows a more flexible approach to project progress.
With the agile life cycle, a project team can move back and forth between phases several times without following the defined project life cycle sequence in the order it is set. So, an Agile project team project cycle sequence may look much messier. Something like this:
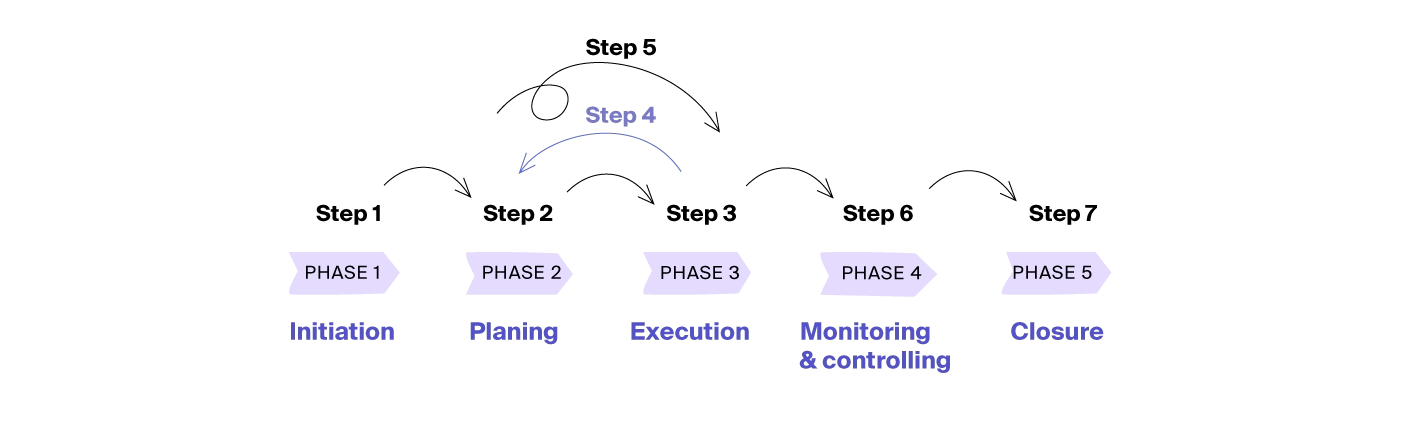
The iterative or agile life cycle is usually applied in software development where the success of the deliverable or end product will be judged and determined by the user. To make sure it meets all the needs and requirements, the team may go back and forth to get more in-depth feedback. They may also choose to refine initial plans and rework some parts of the project execution phase before the final launch and closure.
Incremental life cycle
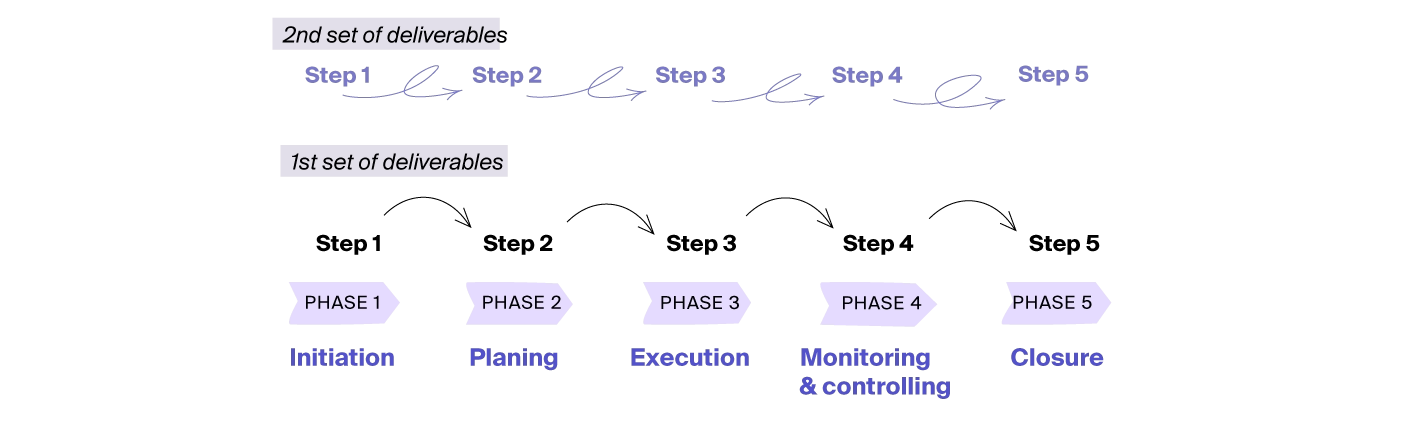
The incremental life cycle is a type of project that divides its deliverables into multiple sets. For each set, they go through the entire project life cycle phase sequence in order. Once one set is complete, they move on to the next one, and so on.
A project that follows the incremental life cycle will use the feedback and knowledge gained from the first set of deliverables to then inform how they approach the second or third set. So they run through the five-phase life cycle multiple times during the one project. Their workflow might look like this:
The incremental project life cycle is ideal for large and complex projects and first-time initiatives. As a project manager, when you don’t know what you’re likely to come up against, this approach can be one of the safest in terms of sticking to costs and timelines.
Use ActiveCollab to manage every project life cycle phase
The project life cycle is a 5-phase process project managers apply to take their project ideas from pitch to delivery. It creates a logical order and serves as a roadmap for the entire project journey.
As a project management and workflow tool, ActiveCollab can help simplify the journey throughout the entire project life cycle. It removes and streamlines much of the complexity in creating invaluable project documentation and sharing it with their project teams and stakeholders.
Create projects and invite stakeholders to have full or limited access to all the documentation at the click of a button. During the planning stage, you can easily develop the whole suite of timelines and schedules in Gantt charts and house them all within the project’s file hub. At the execution, monitoring, and control phases, you can assign and reassign tasks, set dependencies, and track and manage their progress visually. In the closure phase, the final wrap-up will be a breeze because all the information you need will be a click away.
Project managers and product developers love our platform because, unlike many project management tools, it’s super simple to use and has almost no learning curve. With its competitive pricing structure, it’s one of the best options for small to medium teams and startups.
If you recognize yourself in those last sentences, it might be time to give us a go. Sign up for ActiveCollab’s 14-day free trial offer or book a demo with one of our people!