
Without these metrics, you’ll be flying blind – unable to pinpoint where you’re leaking money or burning resources.
We’ve helped thousands of agencies scale and have tailored our features specifically to meet that need: identifying blockers, spotting resource drains, and eliminating them as efficiently as possible.
1. Billable vs. non-billable hours
Billable vs. non-billable hours is your overall business profitability and productivity metric. It shows the distribution of your team’s time across invoiced and non-invoiced tasks, and it’s one of the best ways to work out how profitable your current service rates and internal workflows are.
When your billable hours are higher, it means your business is operating at a healthy (profitable) level because the majority of your team’s time is dedicated to tasks that are money-makers.
On the other hand, when your non-billable hours are high, it means you are spending too much time on internal work you are not getting paid for. So you’re wasting valuable money-making resources on tasks your business will need to cover.
This table explains the difference between billable and non-billable hours.| Billable Hours | Non-Billable Hours |
|---|---|
| Chargeable | Non-chargeable |
| Paid by client | Paid by the business |
| External tasks | Internal tasks |
| Examples: Project deliverable tasks, research, creative, writing, design, client meetings, any service-based tasks you offer | Examples: Administrative duties, team meetings, training, preparing client proposals, business operations tasks for running the business |
How to calculate & track billable vs. non-billable hours
To track and measure your billable and non-billable hours, you need to have the data of your team’s working hours and distributions across tasks over a period of time.
Work management tools like ActiveCollab, let agency teams and service-based businesses log, add, and track billable and unbillable tasks to their timesheets or projects. That way, owners can have a birds-eye view of this breakdown and the profitability ratio or percentage they are operating under at all times.
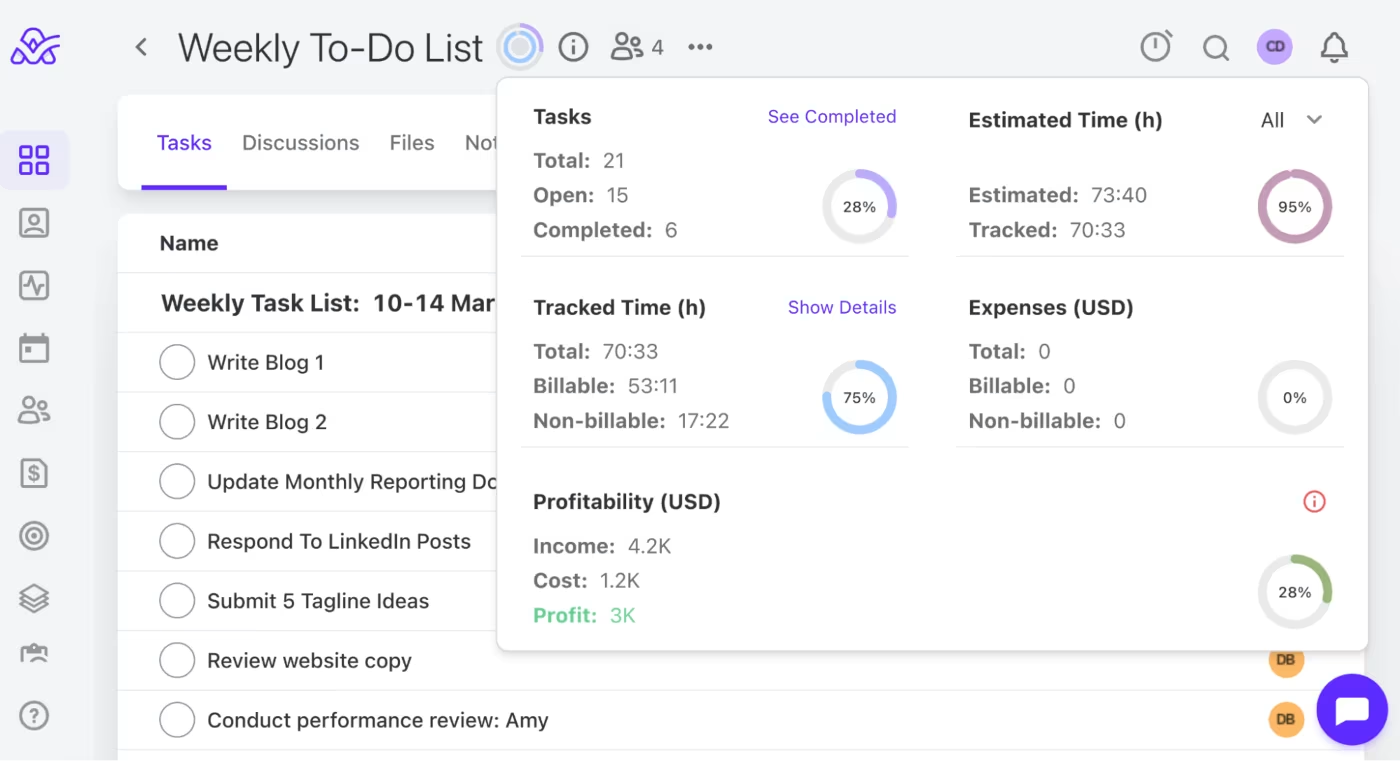
In the image below, under "Tracked Time", you can see that for this particular project, 53 hours are billable, and 17.5 are non-billable. You also have the time tracker, which tells you that 75% of the current task time distribution is dedicated to billable hours.
To calculate your billable vs. non-billable hours ratio, you can also use the following formula:
Billable vs. Non-Billable Hours Ratio = Billable Hours/Non-Billable Hours
For example, if we take the numbers from the example above, where the billable hours are 53 and the non-billable hours 17.5, the calculation would be:
Ratio = 53/17.5= 3.118
If we round this off, the billable vs. non-billable ratio would be 3:1.
This means that for every three hours worked by this employee on this particular project, one is spent on tasks that are not charged to clients.
What billable vs. unbillable ratio should you aim for?
Ideally, you want to stay within the 3:1 or 4:1 ratio or maintain a balance where your billable hours are between 75-80%.
2. Employee utilization rate
Employee utilization is the percentage of an employee's total working hours spent on billable tasks. This sounds similar to the previous metric and it is, but it’s more focused on understanding the working capacity and potential of each employee, so you can work out how efficiently your business is running.
Higher utilization rates mean greater revenue, effective resource allocation, and higher employee productivity and engagement. When your employee utilization is high, it’s basically saying you’re doing a good job on all fronts, from task allocation to capacity planning, and it also says your pricing model or service rates are at an optimal level.
Lower utilization rates mean poor project management or task allocation, misprioritization of work, overstaffing, understaffing, or not having a team with adequate skill sets, and underpricing of your services. When your employee utilization rate is low, it could be a red flag that there are a number of things wrong with the operational setup of your business.
How to calculate & track employee utilization rate
The biggest mistake businesses and agency owners make when calculating their employee utilization rate is using the standard 40-hour working week. The reality is that few people end up doing a 40-hour week. We get sick, we get called into ad-hoc meetings, there's a crisis we need to deal with, and the schedule gets off track.
This is all part of life, and that’s OK. But instead of denying the fact and blindly sticking to this figure, we simply need to factor in the reality of things into our calculation.
By using a 30-hour week capacity (instead of 40), you make room for all those unplanned scenarios and also leave space for creativity, which, let’s face it, is super important for creative agencies.
To calculate the employee utilization rate, use the following formula:
Employee Utilization Rate = (Billable Hours / Total Available Hours) x 100
For example, if we take an employee who is officially employed full-time on a 40-hour week and chooses to set their total available hours at 30 hours per week, the monthly working capacity would be 132 hours (based on the assumption that each month has approximately 22 working days).
If this same employee spends 86 hours working on billable tasks for that month, the calculation would look like this:
Employee Utilization Rate = (86 / 132) x 100 = 65%
So this employee’s utilization rate is 65%. But how good is this? Is it good enough, or should it be higher?
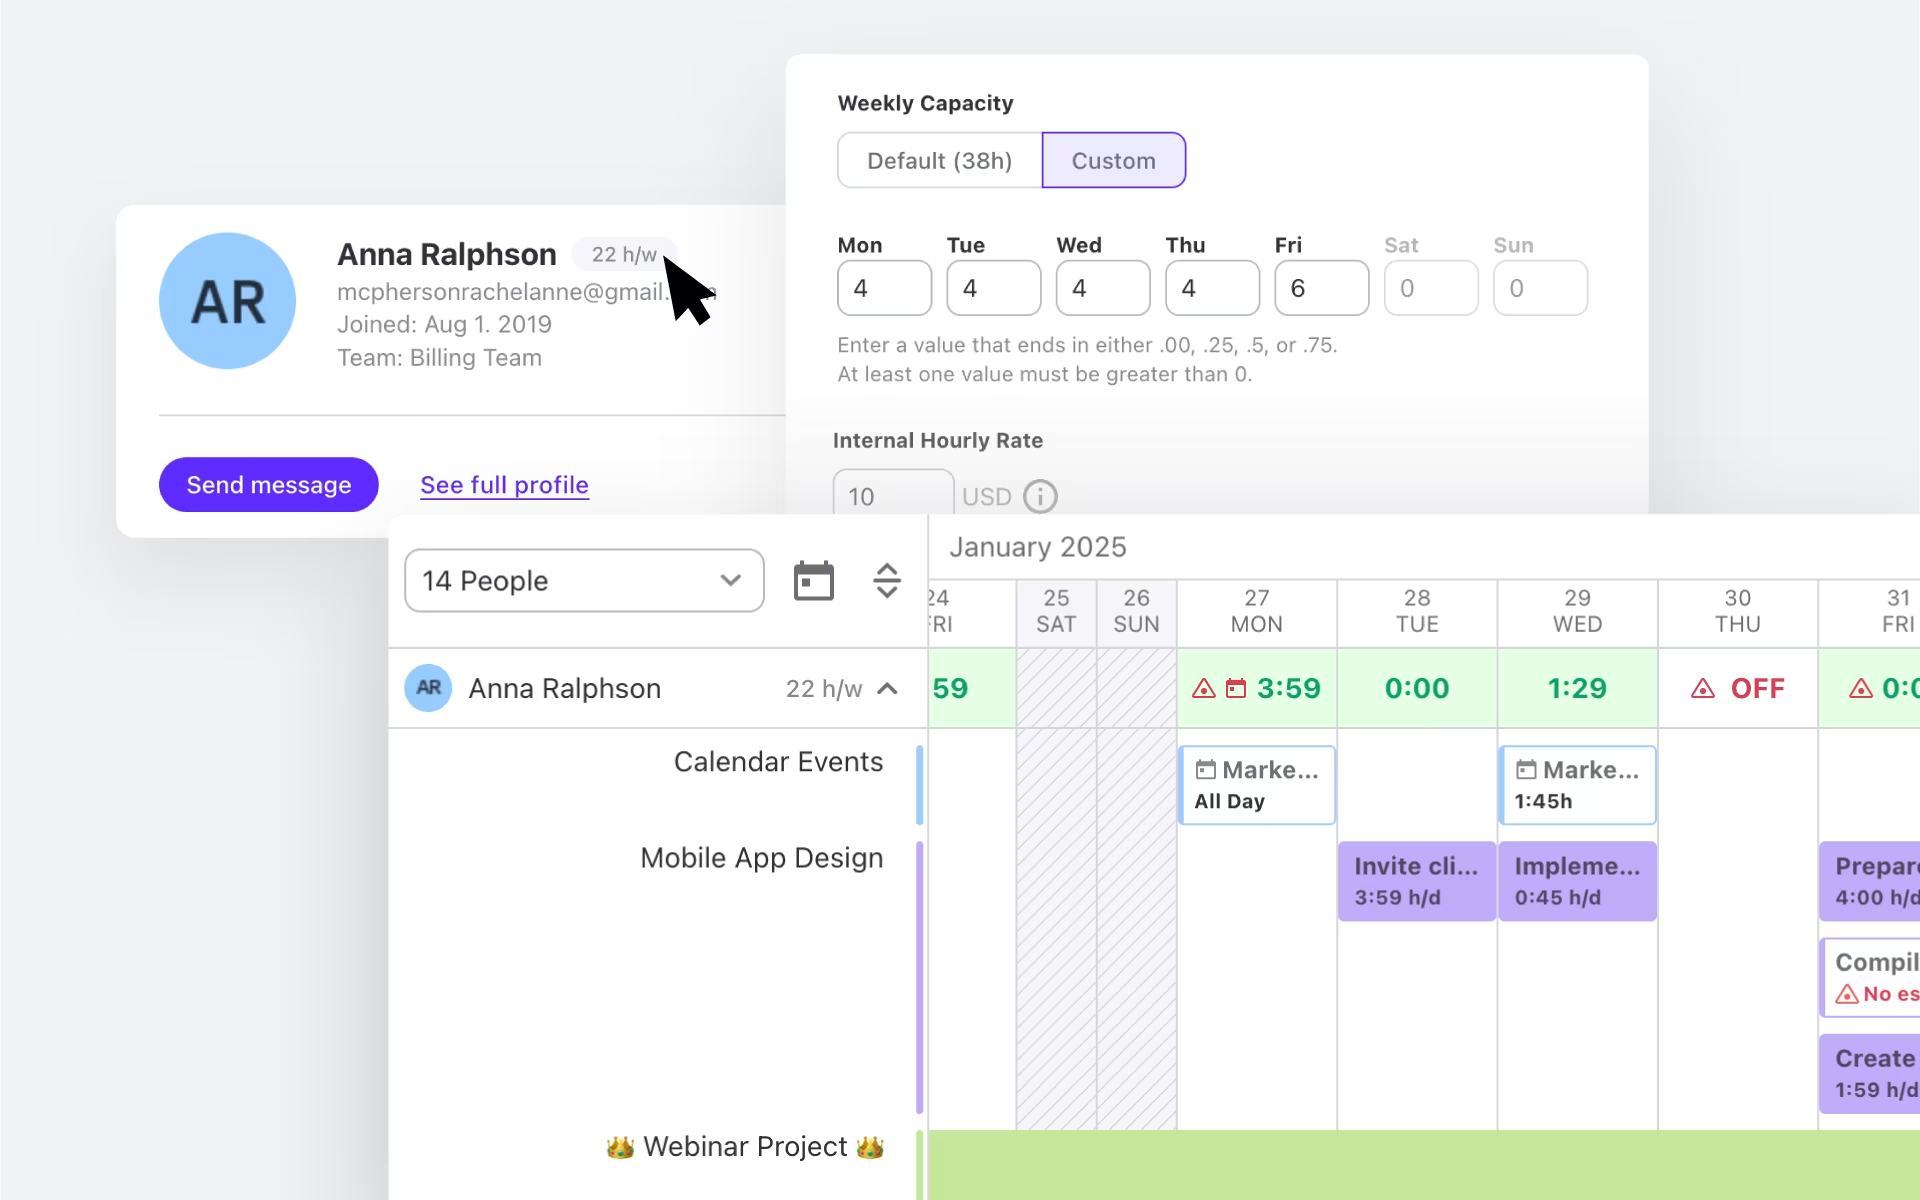
In ActiveCollab, the capacity planning and availability feature lets you use the default 40-hour week capacity or set your own customized capacity per user.
What employee utilization rate should you aim for?
When it comes to employee utilization rates, there is a fairly broad target spectrum that goes from 60-80%, depending on your industry and business type. According to a 2023 business services report, the average employee utilization rate within professional services was just over 69%.
Some agency founders believe that if you set your capacity right, you should be able to achieve a 100% utilization rate. Anything higher could be signaling a burnout risk.
3. Net Profit Margin (% Of Revenue)
Revenue is the total amount of money earned over a set period of time. The net profit margin is the percentage of that revenue that remains as profit once all your expenses and costs are deducted.
Most businesses would analyze revenue and the net profit margin for the business overall. However, you can also look at these metrics on a per-client basis to identify if your agency is a high-value, low-volume model or a high-volume, low-value one.
This table explains the difference between the two.
| High value / Low volume | High volume / Low value |
|---|---|
| Higher pricing, fewer clients | Lower pricing, more clients |
| Niche target market | Broad mass market |
| High profit per sale | Low profit per sale |
| Focused on quality & customer service | Focused on efficiency & scalability |
| Net profit margins above 15% | Net profit margins between 5-15% |
High-value, low-volume businesses tend to have a higher net profit margin. This means agencies who operate under this model are not simply charging for their time or hours; they are charging for the value they provide in expertise, creativity, and granular insight into their small number of clients’ products, customer profiles, and target market.
High-value, low-volume businesses tend to have a lower net profit margin. These types of agencies operate on a ‘more is better’ type of model where they charge by the hour or on retainers for less complex projects. Their focus is to have lots of clients to maintain a high revenue.
How to calculate & track revenue & net profit margin
To calculate your revenue, you need to add up all the payments you've received for your invoiced services. This figure is your total revenue.
To work out your net profit margin, you need to use the following formula:
Net Profit Margin = (Net Profit / Revenue) x 100
For example, if the annual revenue of your agency was $5,000,000 and your net profit was $2,450,000, your calculation would be:
Net Profit Margin = (2450000/5000000) x 100 = 49
So your net profit would be 49%, and you are probably a high-value, low-volume business.
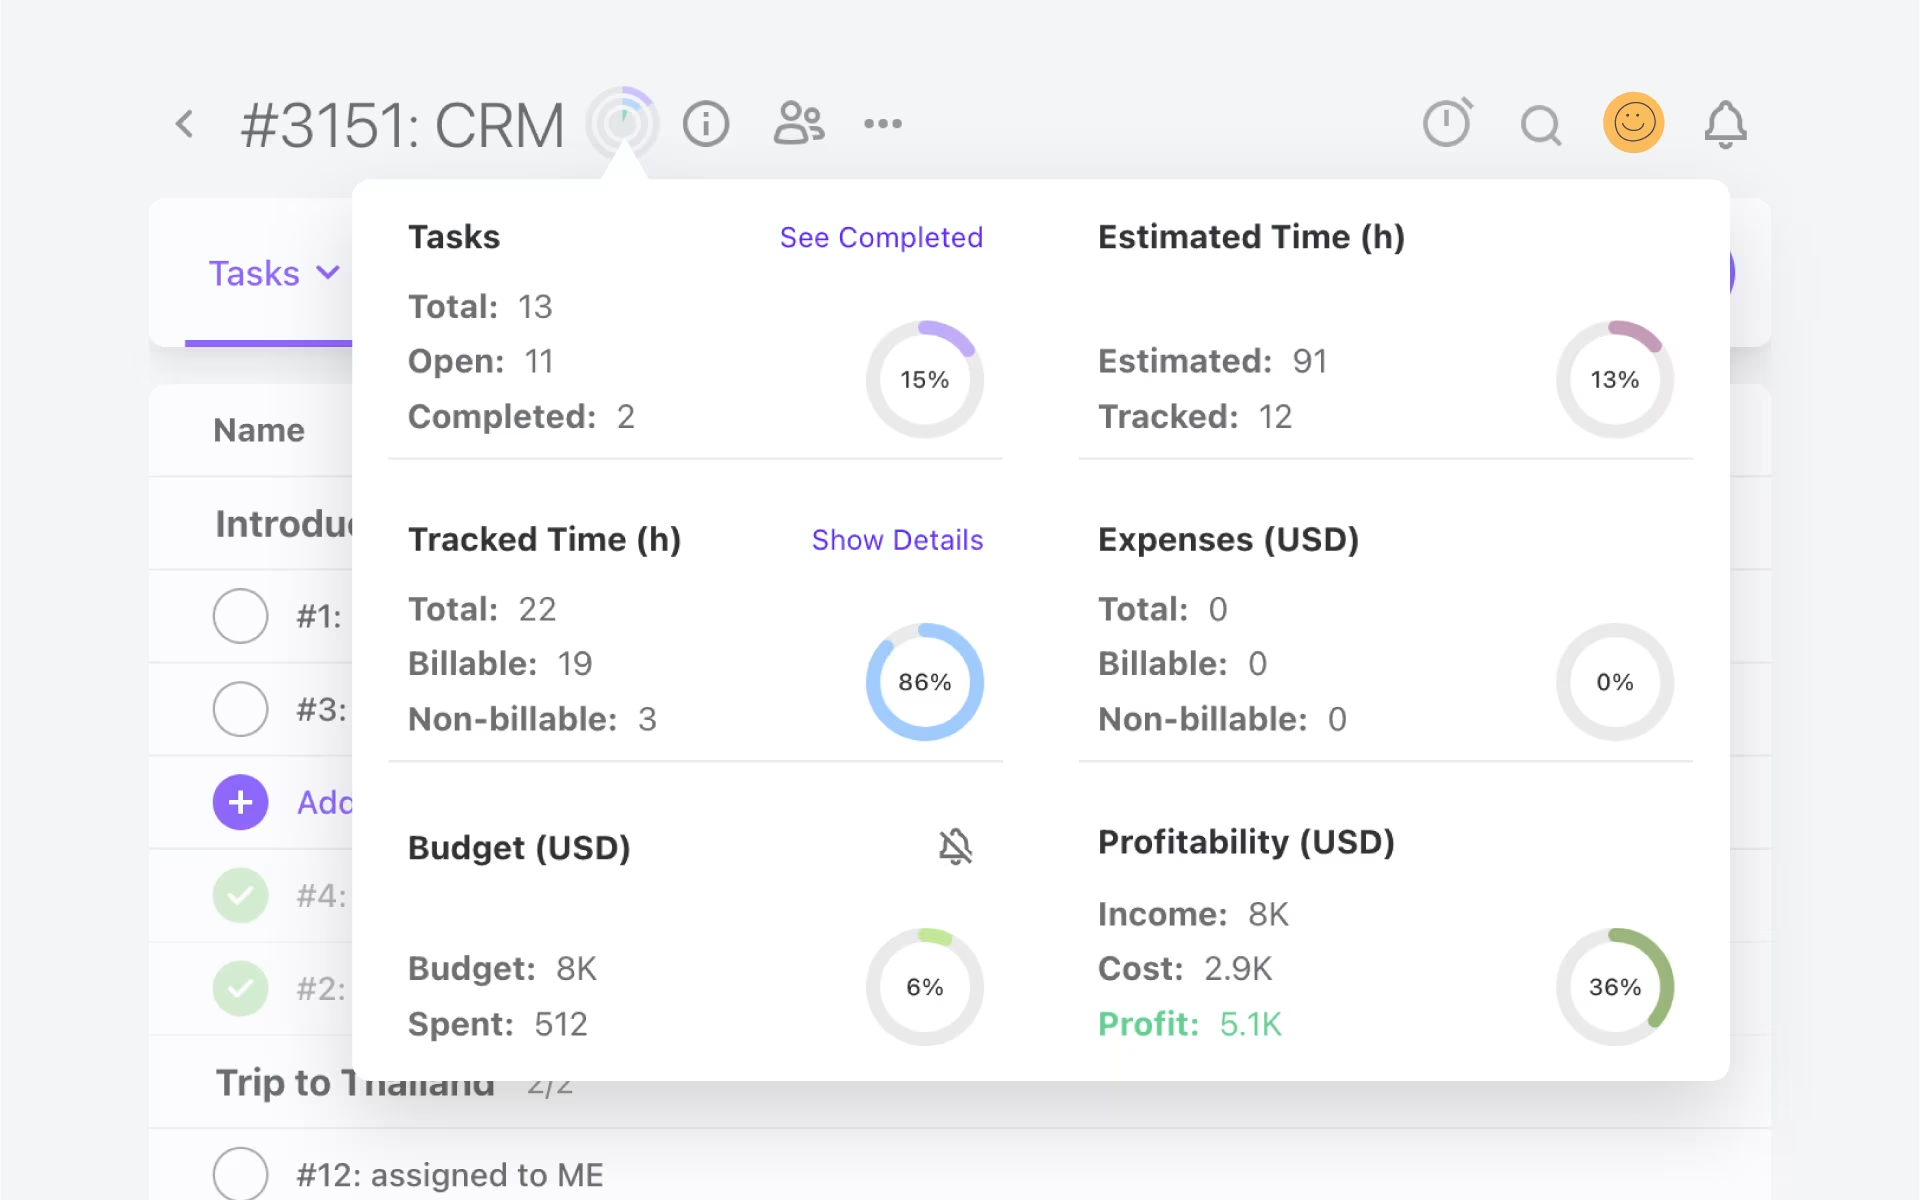
In ActiveCollab, when you create a client project, you can set a project budget and track budget spending and project profitability with just one click through the Project Progress tracker. Here, you will see all the financial metrics you need, such as billable and unbillable time and expenses, as well as budget spending and profitability to date.
What net profit margin should you aim for?
If you’re a service-based business, anything above 30% is a solid net profit margin to work toward or maintain.
4. Labor costs (% of revenue)
Labor cost is the amount of money you need to finance the workforce of your business. This includes wages, salaries, benefits and any other associated costs with your skilled workers.
Understanding and keeping tabs on your labor cost as a percentage of revenue helps to inform your pricing strategy, and also resource utilization. When your labor costs are high, it might be a sign that you need to look at alternatives to optimize your workforce and business operations.
How to calculate & track labor costs
To work out your labor costs as a percentage of revenue, you need to use the following formula:
Labor Cost Percentage = (Total Labor Costs / Total Revenue) x 100
For example: For an agency with a revenue of $1,600,000 and a labor cost of $960,000, your calculation would be:
Labor Cost Percentage = (960000 / 1600000) x 100 = 60
That means the labor cost percentage for this agency is 60%.
What labor cost percentage should you aim for?
For most service-based businesses, labor costs make up the greatest primary expense, and as a percentage of revenue, they can be anywhere from 40-80%. The table shows industry benchmarks for various sectors.
| Industry | Labor cost benchmark (% of revenue) |
|---|---|
| Marketing & Advertising | 45-80% |
| Consulting | 40-50% |
| Law firms | 50-60% |
| Accounting Firms | 40-50% |
5. Operating expenses (% of revenue)
Operating expenses are all the costs associated with running your business, excluding labor costs. They include rent, utilities, insurance, software and technology costs, employee training and development, and marketing or advertising expenses.
For smaller agencies, it’s easier to keep operating costs down. As you expand and get larger, you may need more robust tools and a bigger office space. However, if you operate as a remote team, this can significantly cut operating costs. It also depends on your industry. While law firms fork out large sums of cash for expensive or exclusive office spaces, boutique marketing or design agencies may have a small office (or no office at all!)
How to calculate & track operational expenses
To work out your operating expenses as a percentage of revenue, you need to use the following formula:
Operating Expenses Percentage = (Total Operating Expenses / Total Revenue) x 100
For example, if your agency revenue is $1,350,000 and your total operating expenses come to $350,000, your calculation would be:
Operating Expenses Percentage = (350000 / 1350000) x 100 = 25.926
This means the operating expenses percentage for this agency is 26% (when rounded off).
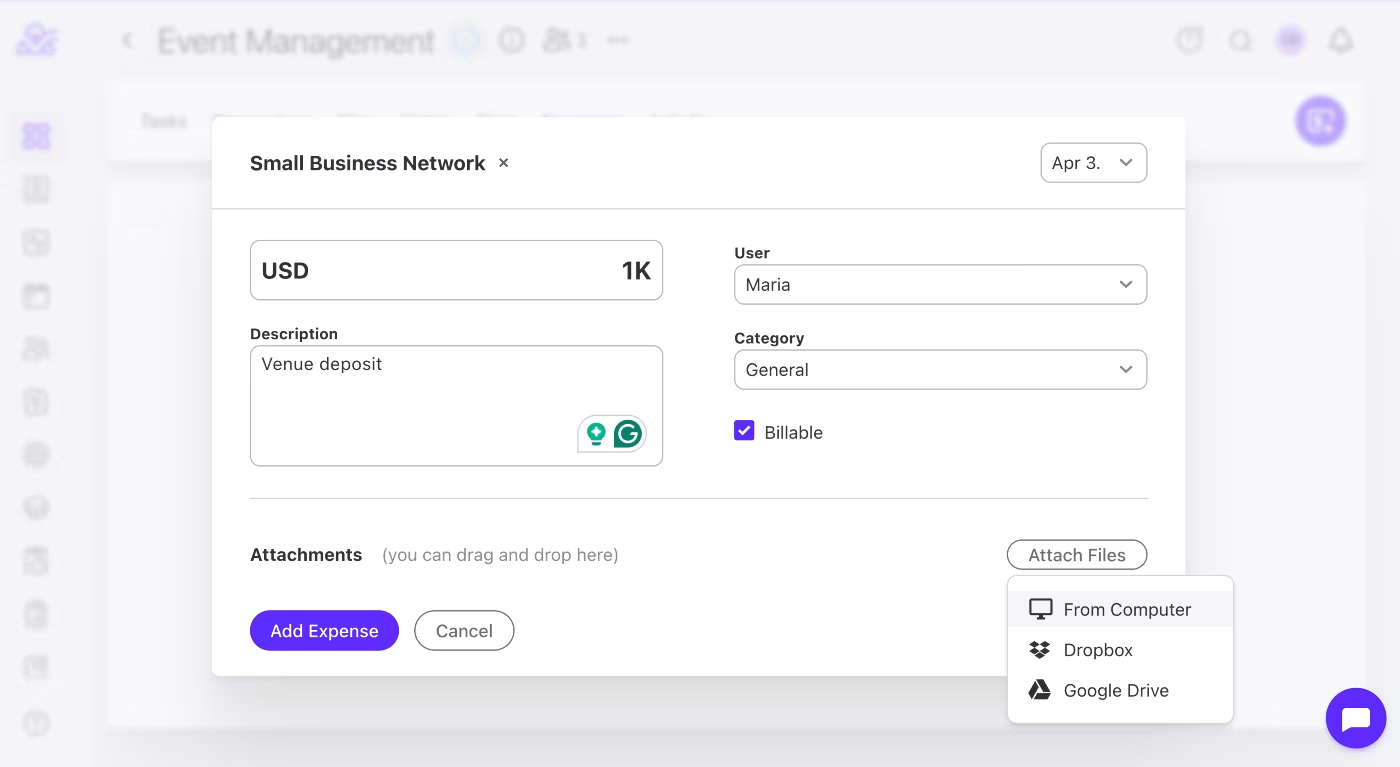
In ActiveCollab, you can add and track all your client expenses within projects or create a separate project for your agency business.
What operational expenses percentage should you aim for?
While there are some benchmarks you can aim for, and you generally want to keep expenses down, this is a highly variable metric in terms of best practice. Some of the standard benchmarks for key service industries are included in the table.
| Industry | Operating expenses benchmark (% of revenue) |
|---|---|
| Marketing & Advertising | 35-55% |
| Consulting | 30-50% |
| Law firms | 30-50% |
| Accounting firms | 25-40% |
| Software Development | 30-45% |
| Architecture & Engineering | 35-50% |
6. Client metrics
In addition to the above business metrics, you should also monitor and track some key client health metrics. These can give you an insight into the quality of your client portfolio, the level of customer satisfaction, and the long-term income potential of your clients.
One vital thing to remember when it comes to client metrics and your overall approach to the distribution of revenue across clients is to establish a maintainable and safe balance from the onset.
Maja Perovic Baines, entrepreneur, former agency owner, and all-round marketing mogul, suggests you follow one golden rule:
Make sure no client in your portfolio brings in more than 20% of your revenue.
If they do, the moment they churn, your business will be at risk. Now, we get that this can be difficult to apply if you are a small agency that’s just starting out, but your first and primary goal should be to onboard 5 clients that each make up no more than 20% of your revenue.
When you’ve got that, you can pick and choose which one of the below client metrics you want to use to measure and track client health on a regular basis.
1. New customer acquisition rate (NCA)
New Customer Acquisition is the number of new clients you acquire over a period of time. This metric helps you evaluate the effectiveness of your marketing and sales efforts.
There are three figures you can track monthly, quarterly, or annually:
1. New client acquisition: Number of new clients you’ve added to your portfolio. There is no formula for this; you simply track and monitor the number. If this number is growing, it usually also means you’ll need to grow your resources.
2. Client dollar value: How much do you earn per new client? This is the total dollar value of the new client win based on the full scope of services you will invoice.
3. Average project value: The average dollar value of each new client project. You might win one client, but they have two projects you’ll work on. To calculate the average project value, simply add up the dollar value of all projects and divide by the number of projects you’ll take on.
2. Client churn rate
The client churn rate is the percentage of clients who leave or stop doing business with you over a period of time. It’s a valuable metric for subscription-based businesses or any business that operates on a retainer model.
Ideally what you want is a low churn rate that is below 5%.
A high churn rate is 10% or more.
This table gives you an insight into what low and high churn rates imply about your business.
| Low Churn Rate (<5%) | High Churn Rate (>10%) |
|---|---|
| Good pricing / good value proposition | High pricing / low-value output |
| High-quality client relationship | Lack of client engagement |
| Good client profile fit for your service offering | Not the right client fit for your service offering |
| Clarity and alignment of client expectations & deliverables | Misalignment of client expectations & deliverables |
| Proper workflows and processes | Inefficient or frustrating workflows and processes |
| Stable & predictable income stream | Unpredictable revenue, difficult to forecast |
| A happy team, working optimally | A stressed team, trying to stay afloat |
Anything between 5-10%, from time to time, is fine, but if it’s constant, you may need to do a bit of research to see why clients are leaving. Is it because they are not happy with your service, or is it something that’s not caused by you?
To calculate your churn rate, use the following formula:
Client Churn Rate = (Number of Clients Lost During Set Period / Total Number of Clients at the Start of the Set Period) x 100
3. Customer lifetime value (LTV)
Customer Lifetime Value (LTV) is the amount you expect to earn from a customer for the entire length of the relationship with your business. This metric helps you determine how much a customer is worth over the long term.
Before you can calculate your LTV, you’ll need two metrics:
Average Revenue Per User (ARPU) – This is the average revenue you earn from each customer per month, quarter, or year.
ARPU = Total Revenue / Total Number of Clients
Average Customer Lifetime – This is the average length of time a customer stays with your business.
Average Customer Lifetime = 1 / Churn Rate
Once you have these, you can use the below formula to calculate your LVT:
Customer Lifetime Value = Average Revenue Per User x Average Customer Lifetime
4. Total client lifetime
Total Client Lifetime is the entire length of time a client stays with your business. It’s an important metric because it gives you an idea of how long you can expect to receive income from a particular client.
To calculate your Total Client Lifetime, use the following formula:
Total Client Lifetime = Sum of All Client Lifetimes / Number of Clients
Use ActiveCollab to help measure & track your agency business health
Your agency may not be a living, breathing human being, but it still needs regular health checkups.
ActiveCollab is a productivity tool that lets you and your team input and store all the important data you can use to calculate your major business health metrics. It can generate financial and time reports by projects, people, and clients so you get granular insights into the dollar value generated by each.
If you want to make sure your business is a well-oiled machine that can keep running on the current setup and with the current client base, you need to keep on top of the numbers.
Use ActiveCollab to set and analyze the distribution of billable and unbillable tasks, track expenses, and set resource capacity levels for your team.
As a tool made for agency and professional service industries, it includes everything you’ll need to not only track the financial health of your business but also to run client operations and workflows from start to finish.
Need help interpreting your agency’s finances and project profitability? Sign up to ActiveCollab’s 14-day free trial or book a demo with one of our people. Let technology do the gathering and report building while you do the strategic thinking.