Project Management

Scrum Metrics: Optimizing Agile Performance

Scrum Metrics: Optimizing Agile Performance

In the dynamic world of project management, Scrum has emerged as an agile framework that fosters collaboration, adaptability, and swift delivery. However, the effectiveness of Scrum is not a matter of chance but a result of continuous measurement, evaluation, and improvement. Scrum metrics are essential in this process, serving as tangible indicators of a team's performance, progress, and productivity. In this article, we will explore the critical aspect of measuring and improving the effectiveness of Scrum.

What Are Scrum Metrics?

Metrics in Scrum are quantitative measures used to provide teams with a tangible way to evaluate their efficiency, identify areas for improvement, and monitor the success of their sprints and overall product development.

In Agile project management methodology Scrum, metrics align with larger frameworks like Agile Release Trains (ARTs) to track and assess a team's performance, progress, and productivity.

These metrics are not just about measuring output; they also focus on how effectively the team works together, how well they're meeting their commitments, and how quickly and reliably they deliver value to the customers.

Leading vs. Lagging Indicators in Scrum

Leading indicators in Scrum are proactive measures that predict the future performance of a project. They include items like sprint commitment and velocity. On the other hand, lagging indicators are reactive measures that reflect past performance, such as completed story points or defect rates. While leading indicators help in planning and adjustments, lagging indicators provide insights for retrospectives and long-term improvements.

How to Use Scrum Metrics?

In Scrum, performance is measured by various metrics that focus on productivity, quality, and efficiency. Scrum KPIs are specific data points that Scrum teams track. Use them to measure sprint goal success, escaped defects and defect density, team velocity, sprint burndown, epic and release burndown, effort estimation variance, cycle time, and number of unplanned items.

  • Sprint Goal Success: This measures whether the team achieved the goals set for the sprint. It provides a clear indication of the team's effectiveness.
  • Escaped Defects and Defect Density: These metrics help understand the product quality being developed. Escaped Defects refer to the defects that make it to production, while Defect Density is the number of defects per project size.
  • Team Velocity: It measures the amount of work a team can handle in a single sprint. Team velocity helps in future planning and estimating the team's capacity.
  • Sprint Burndown: This chart tracks the amount of work remaining overtime. It helps to visualize the progress and predict if the team will complete the work by the end of the sprint.
  • Epic and Release Burndown: These charts track the completion of large chunks of work or product releases over time.
  • Effort Estimation Variance: This measures the difference between estimated effort and actual effort, helping to improve future estimations.
  • Cycle Time: It evaluates how long it takes for a concept or suggestion to become working software, providing insight into the overall efficiency of the development process.
  • Number of Unplanned Items: This metric helps understand the project scope's volatility and improve future planning.

Why Are Scrum Metrics Important?

Scrum metrics are invaluable to both the Scrum team and the wider organization, as they enhance visibility, facilitate planning and forecasting, ensure quality assurance, boost efficiency, motivate teams, and help identify and manage risks.

  • Improved Visibility: Metrics in Scrum provide insights into the team's productivity, efficiency, and quality of work. This helps stakeholders understand how the team performs and where improvements can be made.
  • Better Planning and Forecasting: Metrics like team velocity and sprint burndown allow teams to accurately estimate how much work they can handle in future sprints. This leads to more realistic planning and forecasting.
  • Quality Assurance: Metrics like escaped defects and defect density clearly show the quality of the software being developed. This helps the team to identify areas where quality can be improved, ultimately leading to a better product.
  • Increased Efficiency: By measuring cycle time, teams can identify bottlenecks in their processes and work to eliminate them. This leads to increased efficiency and faster delivery times.
  • Motivation and Accountability: Seeing progress through metrics can motivate the team and hold them accountable for their commitments. This can boost morale and foster a culture of continuous improvement.
  • Risk Management: By tracking unplanned items and effort estimation variance, teams can identify and manage risks early, preventing them from escalating into bigger issues.

How to Improve Scrum Team Productivity?

Improving Scrum team productivity is a complex task requiring a deep understanding of the team's work and the Scrum framework. When applied properly, several specific tactics can lead to significant improvements. Here are some strategies and metrics you can use, focusing on the "Definition of Done", Sprint Goals, and an analysis of team skills, knowledge, and capabilities.

  • Definition of Done (DoD): This is a concise and transparent list of requirements a software increment must meet to be considered complete. It ensures that everyone has the same understanding of what it means for work to be complete while avoiding miscommunication. The DoD should be reviewed and updated regularly to reflect project or team changes.
  • Sprint Goals: These are high-level objectives set for a sprint. They provide direction and promote collaboration by ensuring the team works towards a common goal. Clearly defined sprint goals help the team stay focused and prioritize tasks effectively.
  • Analyze Team Skills, Knowledge, and Capabilities: Understanding the strengths and weaknesses of your team members can help you allocate tasks more effectively and identify areas for improvement. Regular training sessions and opportunities for professional development help enhance the team's skills and knowledge. Additionally, implementing a system for sharing knowledge and best practices among team members can increase the team's overall capability.
  • Metrics: Utilizing cycle time, velocity, and burndown charts can provide valuable insights into the team's performance. For example, cycle time (the time it takes to complete a task from start to finish) can help identify problems in the workflow. Velocity (the amount of work a team can complete in a sprint) can help plan future sprints. Burndown charts (which show the amount of work left to do versus time) can help track progress and predict when all tasks will be completed.
  • Foster a Collaborative Culture: Collaboration is key in Scrum. Encourage open communication, knowledge sharing, and collective problem-solving. Focus on Scrum of Scrums to connect multiple teams and help them generate complex solutions. This technique helps teams develop and deliver complex products through adaptation, inspection, and transparency scale. When you organize your projects in ActiveCollab, communication comes naturally, as you can share the progress on each task through comments and chat with your team in the in-app Chat.

Examples

Examples of Scrum Metrics calculations and interpretations include the following:

Velocity

Velocity is calculated by adding all the story points completed in a sprint. For example, if your team completed five stories in a sprint, each estimated at 3 story points, velocity would be 15 (5 stories * 3 points) for that sprint.

Interpretation: Over several sprints, an average velocity can be calculated to measure how much work the team can typically complete in a sprint. This helps in future sprint planning and workload balancing.

Lead Time

Lead time measures the total time from when a new task is requested until completion. For instance, if a task was requested on the 1st of the month and completed on the 10th, the lead time would be ten days.

Interpretation: A shorter lead time indicates a faster value delivery to customers. If lead times are consistently long, it could signify bottlenecks or inefficiencies in the workflow that need addressing.

Cycle Time

Cycle time is the total time from when work begins on a task until it is finished. For example, if a developer starts working on a task on Monday and finishes it on Wednesday, the cycle time is three days.

Interpretation: Like lead time, shorter cycle times are generally better as they indicate quicker value delivery. Tracking cycle time can help you identify issues in the development process.

Throughput

Throughput is calculated by counting the number of tasks completed in a certain period. For example, if your team completed 20 tasks in a two-week sprint, your throughput for that sprint would be 20.

Interpretation: High throughput indicates a high-performing team. However, it's essential to balance throughput with quality – a high throughput is not beneficial if it leads to many defects. Tracking throughput alongside other metrics can provide a more rounded view of team performance.

Flow Metrics for Scrum Teams

Flow metrics provide insights into the efficiency and speed of a Scrum team's workflow, helping identify issues and opportunities for improvement.

Scrum Chart

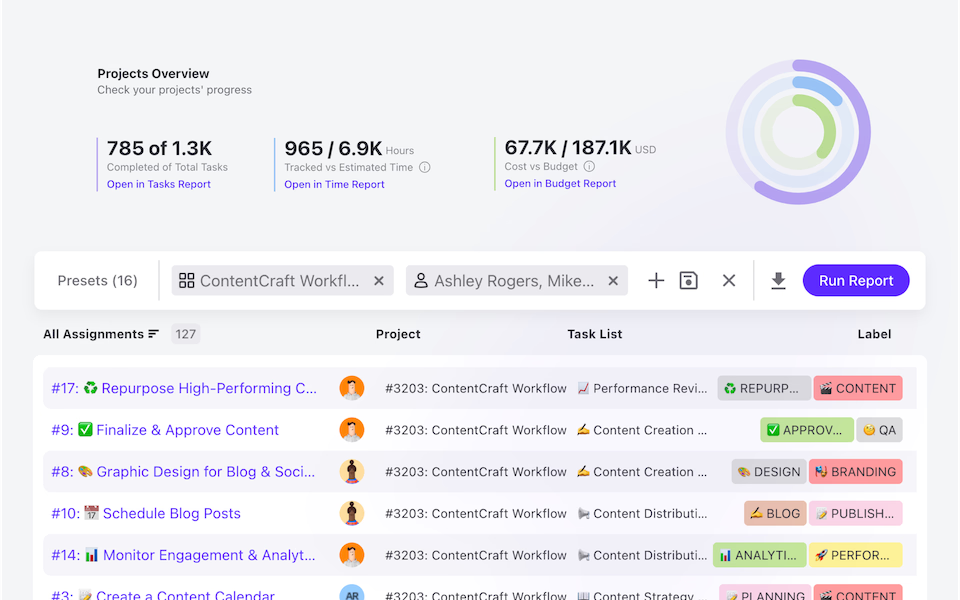
A Scrum Chart (often a burndown or burnup chart) visually represents work completed versus time, providing a snapshot of the team's progress during a sprint.

Progress Metrics

Progress Metrics, such as Sprint Burndown or Velocity, measure how much work a Scrum team completes over time, aiding in planning and performance assessment.

Benefits of Scrum Metrics

Scrum metrics are critical tools for gauging team performance, identifying issues, and enabling informed decision-making in agile project environments. Here are some benefits worth exploring: improved transparency, early issue detections, enhanced collaboration, predictability in delivery, and adaptive planning.

  • Improved Transparency: Scrum KPIs clearly show team performance and progress, fostering stakeholder accountability and trust. The lack of trust profoundly affects all Scrum values.
  • Early Issue Identification: By tracking these metrics, teams can identify problems early and promptly apply corrective actions.
  • Enhanced Collaboration: Metrics can highlight areas where the team needs to work together more effectively, promoting cooperation and shared problem-solving.
  • Predictability in Delivery: Tracking metrics like velocity can help predict future performance, enabling more accurate planning and forecasting.
  • Adaptive Planning: Metrics provide data-driven insights that allow teams to adapt their plans based on actual performance, leading to more realistic and achievable goals.

Challenges Associated with Scrum Metrics

While Scrum metrics offer valuable insights, they also pose challenges such as overemphasizing velocity, resistance to change, lack of empirical data, and misinterpreting metrics.

  • Overemphasis on Velocity: Teams might focus too much on velocity, leading to rushed tasks and compromised quality. It's essential to balance speed with other aspects of performance. Make sure to focus on velocity compression as well. This refers to a common issue in Scrum where teams overestimate their ability to deliver work within a sprint.
  • Resistance to Change: Implementing Scrum metrics can face resistance, especially if it's a shift from traditional methods. Changing management strategies can help overcome this.
  • Lack of Empirical Data: Scrum metrics can lose effectiveness without proper data collection. Teams need to ensure they're tracking and using relevant data accurately.
  • Misinterpretation of Metrics: Metrics can be misunderstood or misused, leading to incorrect decisions or skewed perceptions of team performance.
  • Time-Consuming Meetings: Scrum meetings, while essential, can become time-consuming. It's crucial to keep these meetings focused and efficient.

Download Free Materials
content-image

Project Manager Roles and Responsibilities Cheat Sheet

*Enter your email address and subscribe to our newsletter to get your hands on this, as well as many other free project management guides.

Thank you for subscribing!
Download

Newsletter subscribers can download all free materials


Make Real Work Happen!

Start your trial today, free for 14 days! Onboard your team, plan, collaborate, organize your work, and get paid.

By signing up you are agreeing to the ActiveCollab Terms of Service & Privacy Policy.