PERT
- Tasks are displayed in a network diagram
- Useful in the planning stage of the project
- Developed for managing complex projects by the US Navy in the 1950s
- Low flexibility
- Outlines and calculates the critical path

PERT allows you to pinpoint the start and due dates and reduce the costs and time needed to complete a project!
Both these tools are visual and help managers work on large projects. However, the purpose of their initial invention makes them adapt to different stages and types of projects. Find out which of these tools best fits your needs!
PERT charts are very useful in the planning stage of projects, so managers can identify the best-case and the worst-case scenarios. While it's impossible to predict the future, learning how to create one of these templates in five steps can help you in the planning process.

By listing all your tasks in the table, you get a clear overview of all the steps, which you can subsequently expand by adding information on sequence and the time necessary to complete each activity.
While it is easy to predict the order of some activities, other tasks may require more in-depth analysis, which will help you determine their order more easily.
Once you have established the sequence of activities, you can represent both serial and parallel activities in the diagram. Each event and milestone should represent a node in the network, and you can use arrows to show relationships between activities.
What distinguishes PERT from other techniques is its ability to deal with uncertainty in activity completion time. There are three-time estimates this model typically uses for each activity:
• Optimistic time - the shortest time in which the activity can be completed
• The most likely time - the completion time that has the highest probability
• Pessimistic time - the longest time in which the activity can be completed
After you have identified the time estimates, you can calculate the expected time for each activity by using the following weighted average:
Expected time = ( Optimistic + 4 x Most likely + Pessimistic) / 6
For example, imagine you are building a cottage. Drilling and planting the posts have an optimistic duration of 7 hours, an expected duration of 10 hours, and a pessimistic duration of 12 hours. The optimistic duration is counted once, the most likely time is counted four times, and the pessimistic time is counted once. The entire sum is then divided by 6, and the weighted average is 9,83. You perform this calculation for each event and then share it by inserting it into the duration data column.
By adding the times for the activities and determining the longest path, you create a critical path. The critical path involves the total amount of time necessary to complete the project. The total project time doesn’t change if activities outside the critical path speed up or slow down.
PERT helps project managers identify responsible departments, delegate roles to their team workers, and track results. Gathering information from multiple sources allows you to coordinate project activities and leverage communication between departments easily. Through efficient planning and decision-making, you encourage your team to truly invest their time and energy into delivering the best results.

We already compared PERT and Gantt charts, but we need to put them one beside the other once more. Gantt charts are linear, and you'll notice that one task is dependent on the other, creating a chain of events that lead to the project finish line. PERT charts are a little bit more complicated and can look confusing at first, so let's try to break down the most common dilemmas!
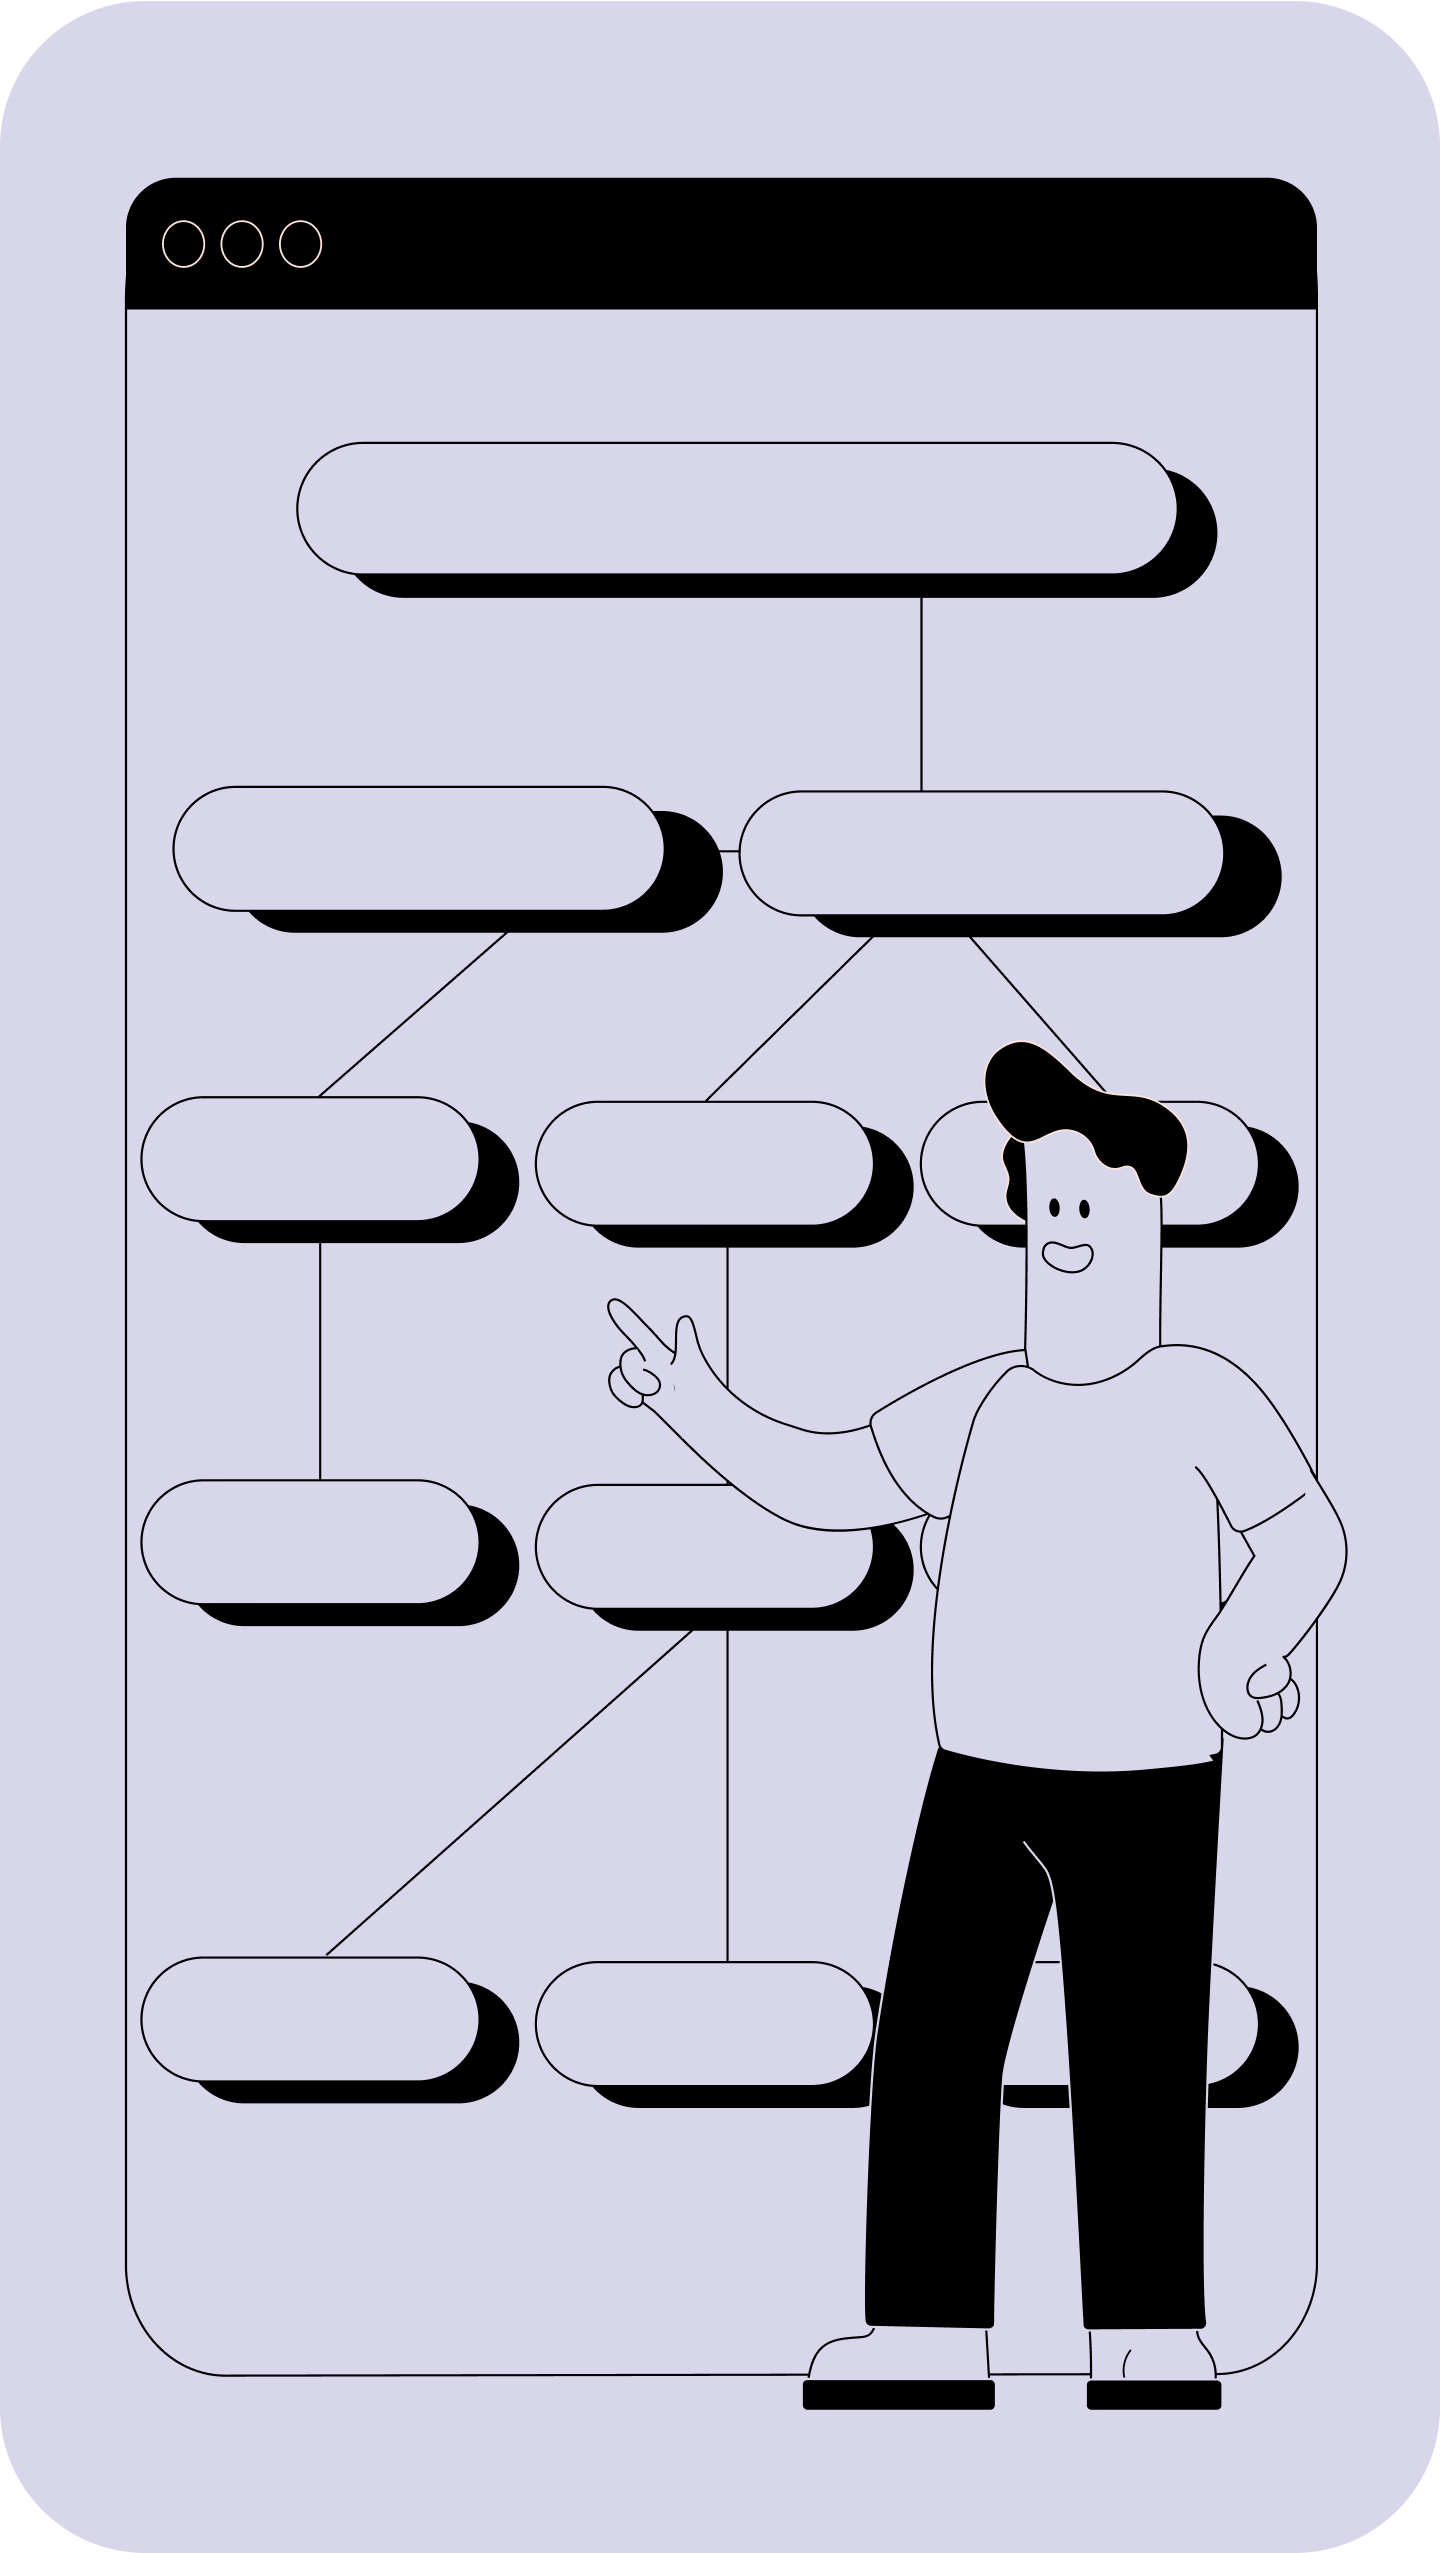
The "boxes" represent project milestones and are also called nodes.
The nodes are connected by lines that represent the tasks that need to be completed so that you can hop from one milestone to the next.
The lines that connect the nodes are in the form of arrows, so they can indicate the order in which the dependent tasks must be completed. For example, you can't start creating a website before getting all the necessary information and files from the client.
The numbers written by the arrows display the amount of estimated time it takes to complete the tasks from one milestone to the other.
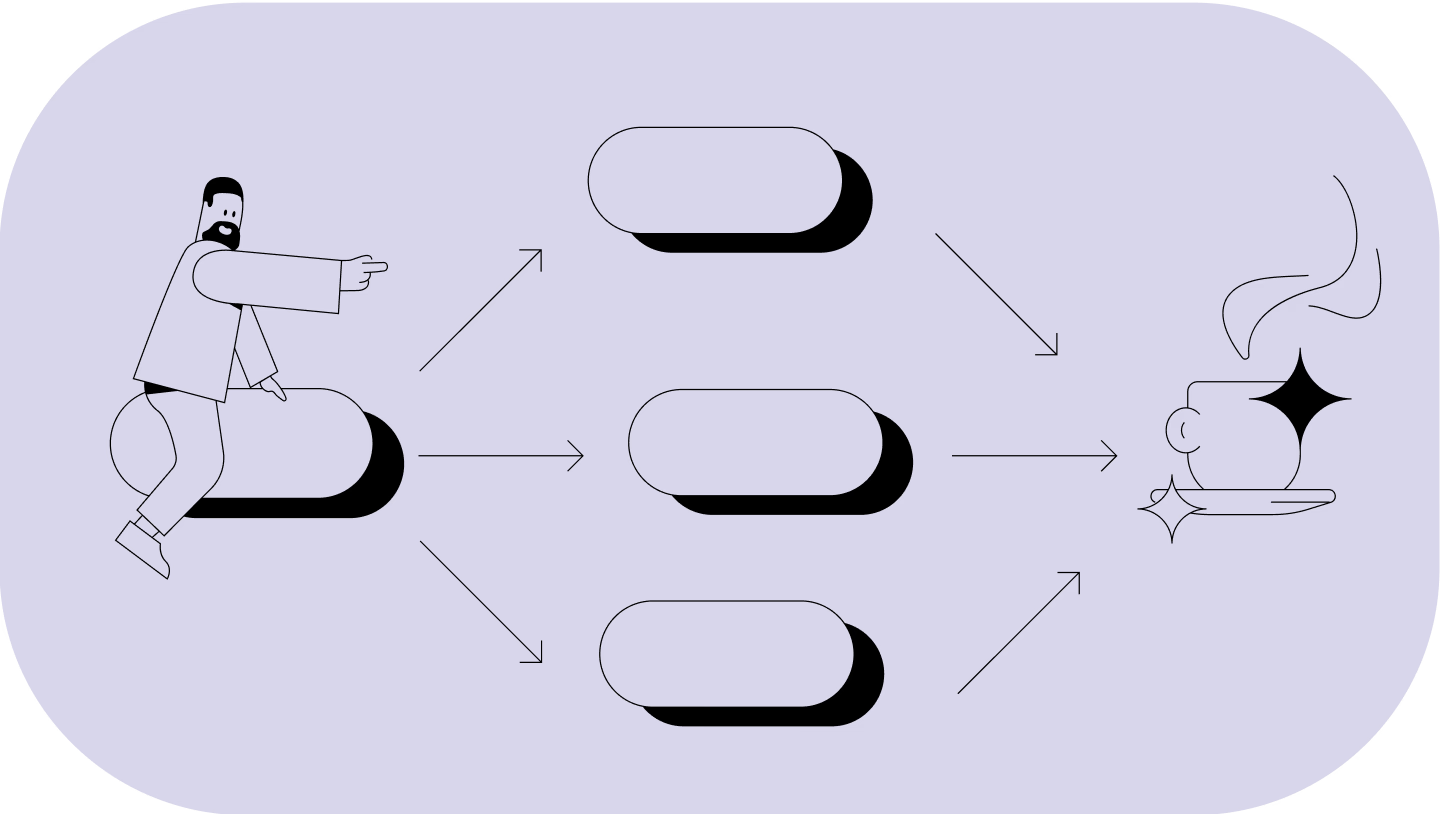
Sometimes, you'll see two diverging lines coming out of one node and reaching two different nodes. This means you have parallel tasks. They are activities that are independent of one another, happen simultaneously, and are also known as concurrent tasks.

Improve your understanding of project risks
Learn how to use other methodologies
We’ll follow the template described above to illustrate the example of going on vacation. So, you’ll need to list all the necessary activities. In our example, those would be: booking a flight and accommodation, researching interesting places to visit in the area, doing the math on how much money you need, getting days off, packing, agreeing with your travel companions on the dates and destination, and choosing the destination. Naturally, these activities need to be put in the right order, meaning you’ll probably agree with others on the destination first and pack in the end.
Then, you’ll use software to create a diagram and represent these activities as nodes. You’ll also create dependencies by connecting them with arrows, which will give you a clear idea of the activity sequence. Schedule your tasks and give them a time estimate, so you can then calculate their optimistic and pessimistic versions. Finally, create a critical path, add up the estimated times of the tasks on it, and you’ll know how much time it will take you to complete the project of going on vacation and the necessary steps you need to take.

Continue reading
Project Management Methodologies Introduction
Get familiar with the most popular methodologies modern project managers use! Learn the basics and choose the best method to manage your teams and projects.
