Capacity Planning
See the individual’s capacity and plan for the projects coming in.
Ensure you have a qualified workforce for project delivery, maximize your teams’ productivity, and forecast staffing needs.
needed
Capacity Planning for Optimal Organization and Team Success
Perfect for demand forecasting and resource allocation. Manage your team’s capacity, skills, and rates across projects and task.
Job Types and Rates
Set different job types and internal hourly rates for your team members for better resource allocation and budgeting.
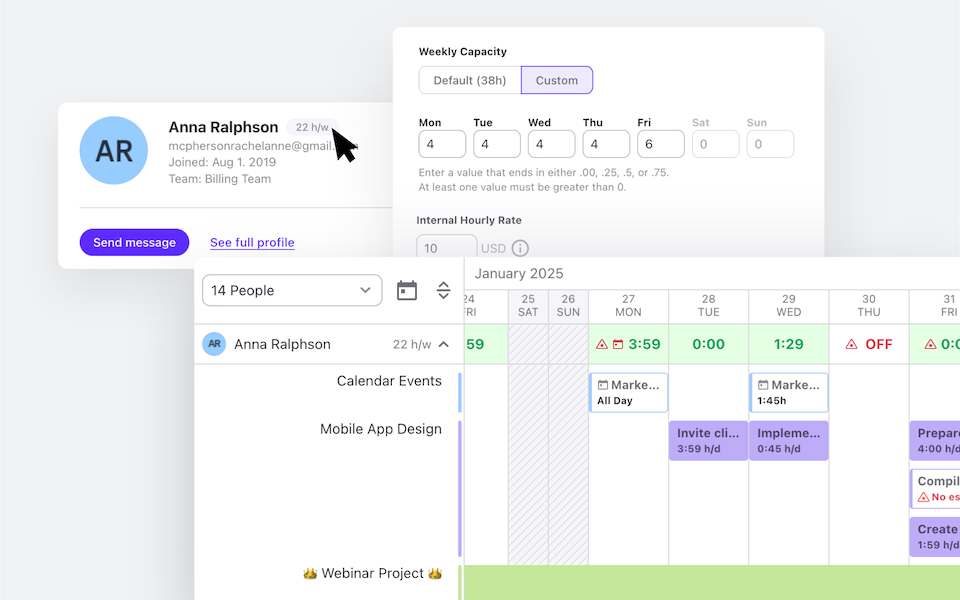
Daily and Weekly Capacity
You can set default or custom daily or weekly capacity for every team member, and use this information for projects, planning, and reporting.
Individual and Team Timesheets
Use individual timesheets to see if someone’s reached or exceeded their daily capacity to improve task and people management, and ensure no one’s overworked or struggling.
Availability
Refer to Availability to track when someone’s away from work (birthday, sick leave, holiday..), so you can reassign their tasks or reorganize workload.
Resource and Workload Management
An interactive dashboard helping you streamline your people and ongoing projects.
Workload Overview
View what each member of your team is working on for up to a year in advance, including their capacity, tasks without time estimates, and unassigned work.
Calendar
Refer to color-coded Calendar for a bird’s eye view of task assignments, everyone’s capacity, and time off.
Drag and Drop
Use the drag and drop feature to assign or reassign tasks, and see people’s hourly capacity immediately updated based on task time estimates.
Visual Flags
Know when something’s not right thanks to our visual signals, like when someone has a due task on a day off.
"ActiveCollab helped in making the transition smooth when we were pushed toward home working and was one of the key factors in maintaining the quality of our work."
Interior Designer, Havelkadesign
"ActiveCollab sounded too good to be true. We went into our trial period with low expectations – to our surprise and delight, we were proven wrong."
Founder and Creative Director, JUICE Creative Group
"ActiveCollab allows our teams to ask questions, track and update statuses, report time, and communicate effectively and efficiently."
Director, Strategic Accounts, Xivic
"We've gotten way more efficient with our time management and communication, and a big part of that is because of ActiveCollab."
Founder and Managing Director, Rock Agency


Project Management Workflows
Where your team and clients come together.
A heart of your business. Turn any idea into reality through our time by using ActiveCollab project management software. Made for growing businesses alike.
Task Key Dates and Time Estimates
Track the time you spend on every project and task.
Across teams, clients. Projects and tasks. Add notes to the time tracked and associate it with a specific rate card and project.
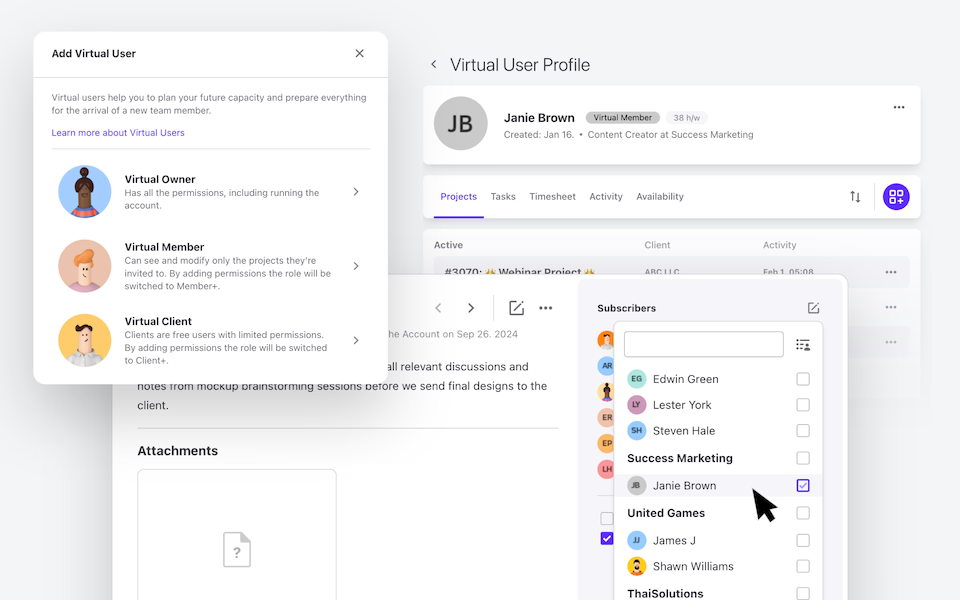
Virtual Users - Your Little Secret for Smooth Growth
Use virtual users to set up tasks, onboarding, and projects for your newcomers or plan for growth. Add as many virtual users as you need at no cost.
Success and Support
50K Teams
93%
Happiness Score
Help Center
Additional Onboarding Services
Engaged Community
Frequently
Asked
Questions
Here is more info to help you decide. Contact our Customer Success team if you have other questions.
ActiveCollab gives you a clear picture of how much your team can realistically handle. By tracking availability and existing commitments, the capacity planning software helps you see what resources remain before saying yes to new projects.
Instead of relying on gut feeling, you make data-backed decisions about workload and deadlines. This clarity protects your team from overextension while ensuring clients get realistic timelines!
Yes! ActiveCollab lets you define custom capacity limits for every team member.
That includes adjusting for part-time hours, vacations, public holidays, or other commitments. This makes planning more accurate and keeps managers from over-assigning work during weeks when capacity is reduced.
By reflecting each person’s true availability, the capacity planning software helps align project schedules with real-world constraints, avoiding stress and keeping projects on track!
Absolutely! ActiveCollab shows both workload demand and actual capacity side by side. When assignments exceed what your team can handle, the mismatch becomes clear right away.
This early warning gives you time to shift tasks, adjust deadlines, or bring in extra support before issues escalate. It’s a simple way to balance project needs with available resources and ensure commitments remain realistic!
Capacity planning in ActiveCollab is flexible – you can view capacity by individual, by role (such as design, development, or project management), or by the entire team.
This makes it easier to see not just who has availability, but what type of capacity you have. Agencies benefit from knowing whether they’re short on designers, overbooked developers, or stretched project managers, and can adjust accordingly!
Yes, and it’s a game changer for agency growth! Capacity planning reports in ActiveCollab highlight where roles are maxed out or underused.
If your designers are constantly at capacity, you’ll know it’s time to hire or bring in contractors. If certain skills sit idle, you can reassign them to higher-value projects.
Instead of reacting too late, you make confident, data-backed staffing decisions that boost productivity, keep teams balanced, and protect profitability!
Absolutely! Capacity isn’t fixed, and ActiveCollab adapts as reality shifts. Someone on vacation? Reduced hours? A new hire onboarded?
You can update capacity in seconds, and the system instantly recalculates project impact. This flexibility means your planning is always accurate, not based on outdated assumptions.
Agencies love it because projects keep moving smoothly even when circumstances change. It’s capacity planning that truly works in real time!
Yes, and that’s where it gets powerful!
ActiveCollab connects time tracking with capacity planning to give you the full picture: how much work has already been logged and what’s still possible. No more guesswork, no more double-booking.
You’ll know exactly where your team stands at any moment. This integration helps agencies plan smarter, deliver on time, and keep clients happy. It’s clarity that turns capacity planning into a true strategic advantage!