I was refactoring ActiveCollab’s datepicker and came across a problem: to close the popover, I’d always have to trigger one extra keypress event.
Chrome’s debugger
Commonly, you’d use JavaScript to attach an event handler to do something when you click a button on a web page. You’d create a button, add some JavaScript to capture the click, and then execute a function.
However, we have a problem when those buttons start piling up: with so many elements, it’s hard to see what happens where and why.
Fortunately, Chrome’s DevTools have their own debugger.
It’s easy to issue a `debugger` statement anywhere in the code and stop the JavaScript execution at a particular line. From there, you can see your local variables and stack trace up to the point where debugger stopped. You can step over and into functions, just like in any other debugger.
Solving the problem with events
The problem with events (or with pub/sub pattern in general) is that you can’t really be sure who’s listening to data changes that the publisher emits.
First I tried DOM Breakpoint, a breakpoint that activates on DOM changes (attribute, node content, etc.). It didn’t work.
After some time, I stumbled upon a lesser-known DevTools’ function: `monitorEvents()`.
The monitorEvents() method instructs the DevTools to log information on the specified targets. The first parameter is the object to monitor. All events return if the second parameter is not provided. To specify the events to listen to you may pass either a string or an array of strings as the second parameter.
— Chrome Developer Tools docs
Translated to plain English — open the console, find an element whose events you’d like to debug (in my case ‘body’, so I see them all), and call:
monitorEvents(document.getElementsByTagName(‘body’)[0], ‘mouse’)
This monitors all mouse events (enter, leave, click, dblclick…) and log their contents to the console from where you can inspect them.
This sometimes helps, but in my case, it didn’t: I had every info about the event but none about its callers.
The Solution
To get the callers, I used Event Listener Breakpoints, a panel in DevTools’ Sources tab (which does the same as pausing the execution on every page event).
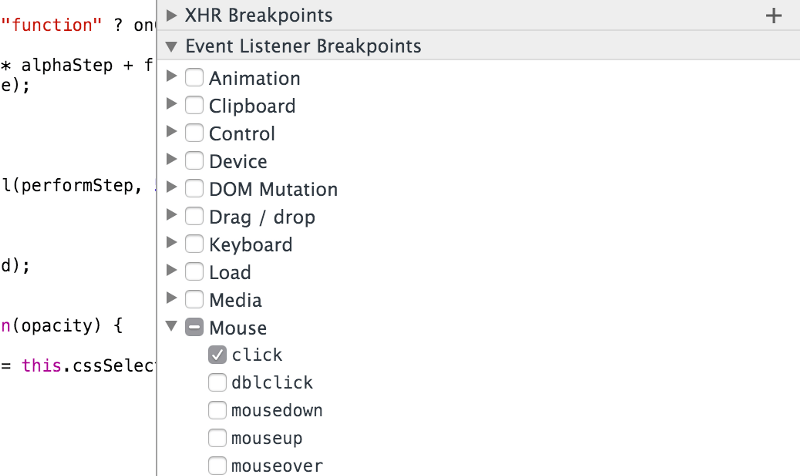
There I could scope the event type as I needed and break only on click events, keypresses, etc.
It turned out to be the right solution — the source of my frustration was the Vimium chrome extension, which attaches itself outside the `<body>` and adds its own event listeners to `<html>`.
So, the whole problem was that I was trying to inspect events on the `<body>` and I skipped the one that was causing misbehavior because I didn’t take into the account other things that could affect the environment.
TL;DR: Turn off extensions when you’re developing stuff. Or develop in incognito mode.
P.S. Remember to turn any Event Listener Breakpoints off after you’re done debugging because they persist and are turned on every time you start the browser